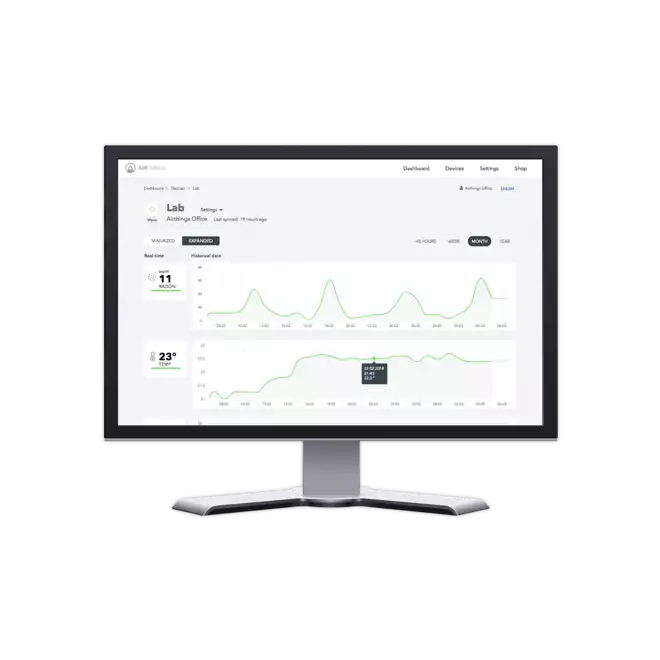
Quickly view, customize and analyze the sensor data from all of your devices at a glance. You’ll also have access to trends and advanced analytics.
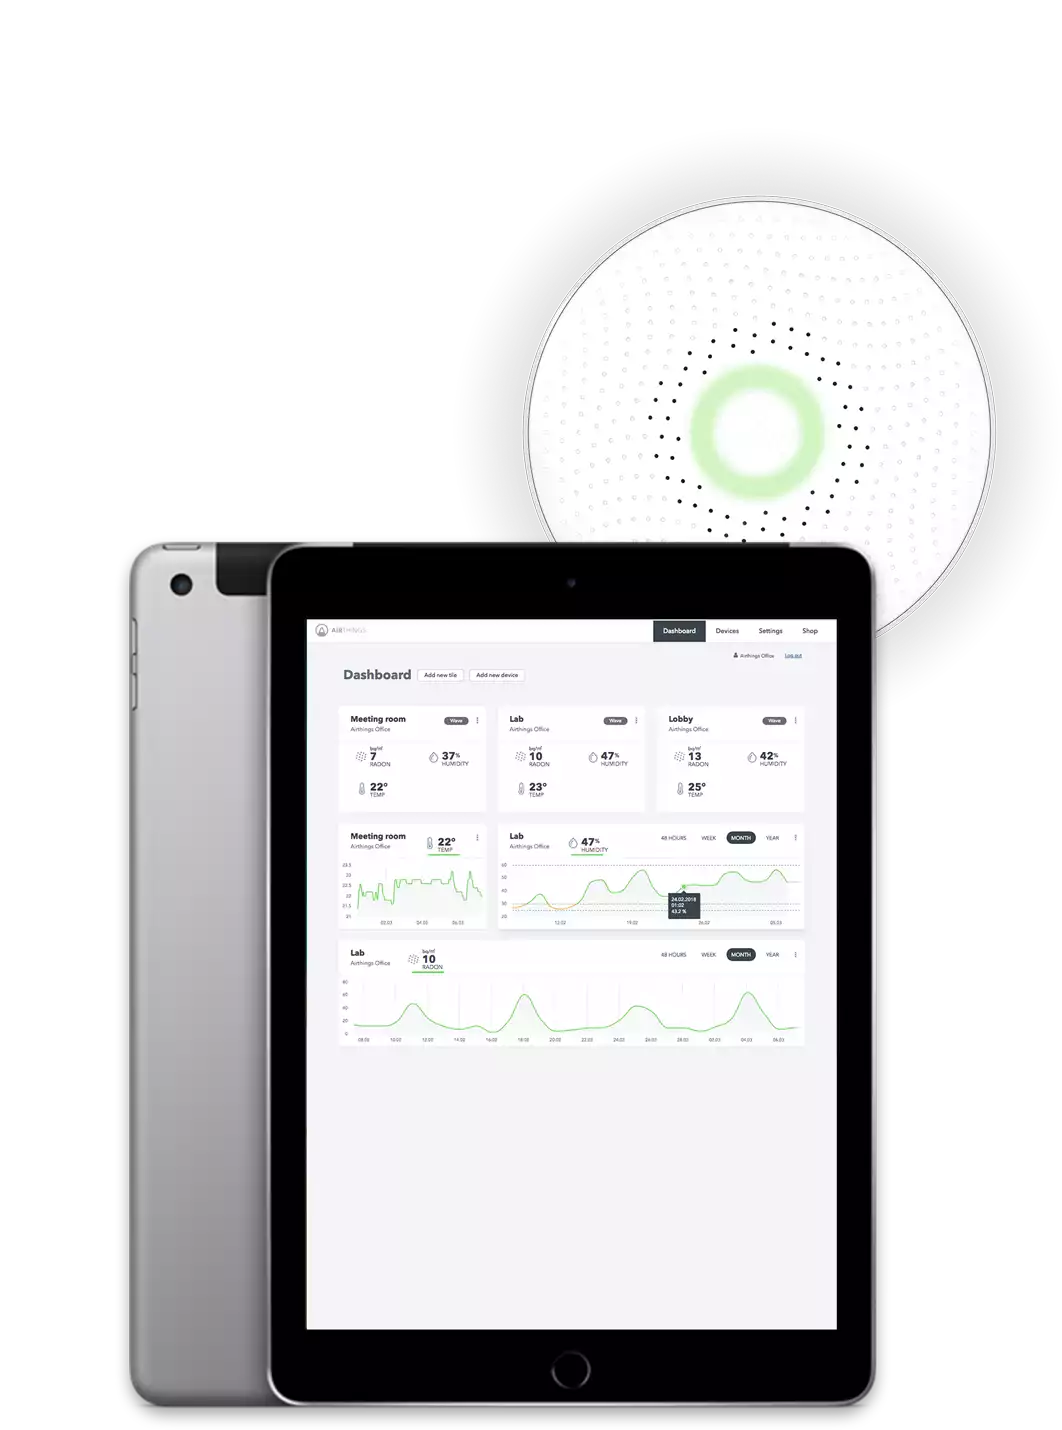
Simply log in with the information you used when setting up your Airthings Wave. The Dashboard will already be loaded with the data from all of your Wave devices. In addition, you are able to set up new devices using the dashboard.
Device tiles
Device tiles sum up the sensors on that device. Click on a device tile to drill down on that device and get more detailed information.
Sensor tiles
Sensor tiles show a graph of your levels for an individual sensor.
Customize by changing the width of the tile, or changing the display between 48 hours, one week, month or year.

≥150 Bq/m3
≥100 and <150 Bq/m3
<100 Bq/m3

>25 °C
≥18 and ≤25 °C
<18 °C

≥70 %
≥60 and <70 %
≥30 and <60 %
≥25 and <30 %
<25 %